Analyzing Federal Reserve policy decisions in addition to data from the purchasing managers’ index can give us three scenarios for the bitcoin price.
Darius Dale is the Founder and CEO of 42 Macro, an investment research firm that aims to disrupt the financial services industry by democratizing institutional-grade macro risk management processes.
Key Takeaways
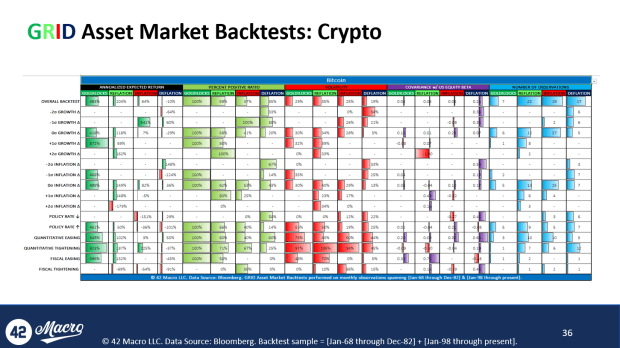
The distribution of probable economic outcomes — and by extension, financial market outcomes — is as flat and wide as it has been in recent years. 42 Macro’s base-case scenario of deflation calls for an expected return of -10% annualized for bitcoin. Our bull case scenario of deflation plus policy rate decreases calls for an expected return of +29% annualized for bitcoin. Our bear case deflation plus quantitative tightening calls for an expected return of -37% annualized for bitcoin. Critically, all three scenarios are equally probable over the next three to six months. If we sounded highly convinced issuing sell warnings at every lower high in bitcoin’s price from early-December through July, we should sound equally unconvinced today.
The Base Case
U.S. and global growth continue to slow, albeit at a more modest pace than in recent quarters. The Fed and other central banks continue to procyclically tighten monetary policy through year end: soft-ish landing.
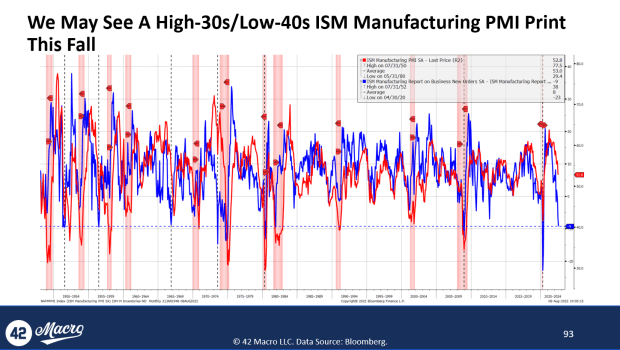
Bayesian spotlight: The slowdown in the headline ISM Manufacturing to the lowest level since June 2020 was an afterthought relative to the decline in the “new orders less inventories” spread falling to -9. This is the lowest level since December 2008. There have only been eight such instances where the spread troughed at current or worse levels. The median trough ISM Manufacturing reading in such instances is 38.6, which is typically reached one month later on a median basis. The median trough ISM Manufacturing reading when the spread troughs +/- 1 point from its current level of -9 is 42.5, which is typically reached three months later on a median basis (n=4). All told, it would be wise for investors to stress test their portfolio holdings for, at best, a low-40s ISM Manufacturing statistic this fall.
The Bull Case
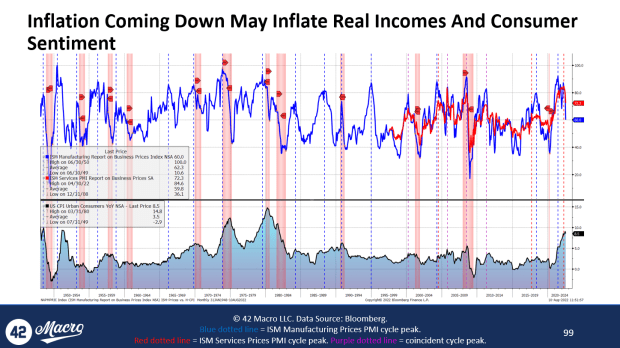
U.S. inflation momentum continues to decline sharply, likely causing the Fed to pause after a final rate hike in September. The improvement in real incomes pulls forward the positive inflection in growth: soft landing.
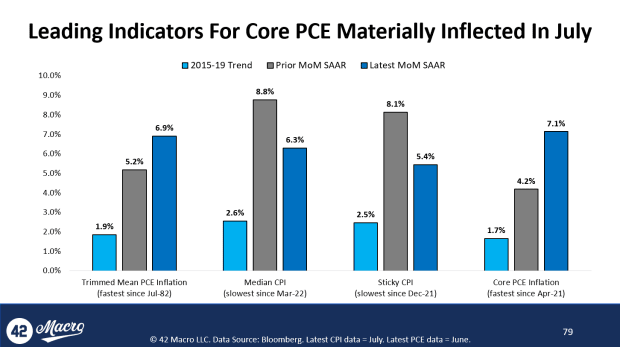
Bayesian spotlight: The July consumer price index (CPI) release represented the river card in a trifecta of data points: July ISM Services PMI, July Jobs Report, July CPI, that all lend credence to the soft-landing view. While the downside surprises on both headline CPI (0.0% month-over month versus 0.2% estimate) and core CPI (0.3% month-over-month versus 0.5% estimate) were to be celebrated, the brunt of the good news came via the sharp slowdowns in median CPI (-250 basis points to 6.3% month-over-month annualized) and sticky CPI (-270 basis points to 5.4% month-over-month annualized) because these indicators track core personal consumption expenditures (PCE) — the Fed’s preferred inflation gauge — better than most other CPI time series. If the deceleration in these leading indicators continues at the same pace and if historical correlations persist, we could be looking at month-over-month annualized rates of core PCE of roughly 2% in the August or September data. Those are obviously two very big ifs, especially considering we are devoid of historical examples of this kind of non-recessionary inflation dynamism to adequately train a model on. At any rate, the possibility the Fed could be heading into its November 2 meeting with “clear and confirming evidence” that inflation is likely to trend back towards its 2% target in a reasonable timeframe is shocking to type, but type it we must, considering August PCE is released on Sept. 30 and September PCE is released on Oct. 23.
The Bear Case
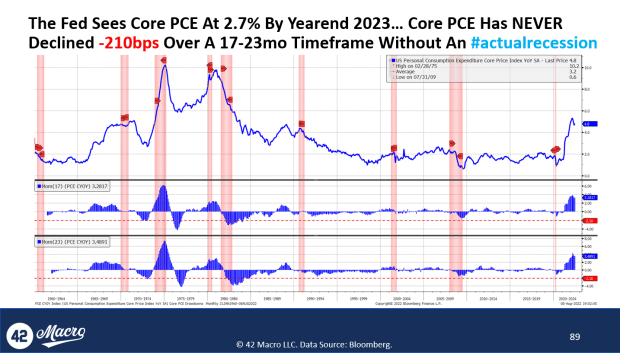
The nascent deceleration in inflation momentum stalls out at levels inconsistent with the Fed’s price stability mandate, causing the Fed to tighten well into 2023: hard landing.
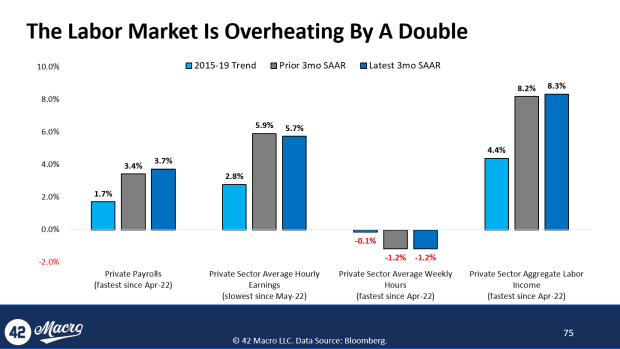
Bayesian spotlight: The labor market is overheating by a double, relative to pre-COVID trends. The hotly debated 528k month-over-month “headline nonfarm payrolls” figure for July obviously stole the show from a market response perspective. The reacceleration in the three-month annualized growth rates for headline (+40 basis points to a three-month high of 3.5%) and private payrolls (+30 basis points to a three-month high of 3.7%) is suggestive of a domestic labor economy that is not responding to the policy tightening we have accumulated thus far. With the three-month annualized growth rate of private sector average hourly earnings slowing modestly (-20 basis points to a two-month low of 5.7%) alongside unchanged private sector average weekly hours growth of -1.2%, it is clear the +10 basis points uptick in aggregate private sector monthly earnings — to a three-month high of 8.3% — was largely driven by more workers finding work.
This is a guest post by Darius Dale. Opinions expressed are entirely their own and do not necessarily reflect those of BTC Inc. or Bitcoin Magazine.


