


A contrarian take on the current market structure suggesting that the bitcoin bottom is near and the Federal Reserve will reverse its hawkish course.
)
Next topic we cover in the podcast is rent. I very often hear misunderstandings of the CPI measure on shelter and specifically owners’ equivalent rent (OER). For starters, it’s very hard to measure the impact of increases to housing costs on consumers in general. Most people do not move very often. We have 15- or 30-year fixed-rate mortgages that are not affected at all by current home prices. Even rental leases are not renewed every month. Contracts typically last a year, sometimes more. Therefore, if a few people pay higher rents in a certain month, that does not affect the average person’s shelter expenses or the average landlord’s revenue.
Taking current market prices for rentals or homes is a dishonest way to estimate the average cost of housing, yet not doing so is the most often-quoted critique of the CPI. Caveat: I’m not saying CPI measures inflation (money printing); it measures an index of prices to maintain your standard of living. Of course, there are many layers of subjectivity in this statistic. OER more accurately estimates changes in housing costs for the average American, smooths out volatility and separates pure shelter costs from investment value.
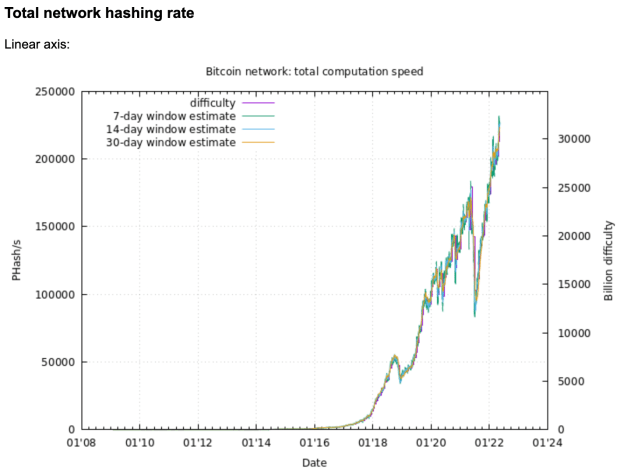
The rest of the episode is talking about the current bitcoin price action. I start my bullish rant by showing the hash rate chart and talking about why it is a lagging and confirming indicator. With the hash rate at all-time highs and consistently increasing, this suggests that bitcoin is fairly valued at its current level.
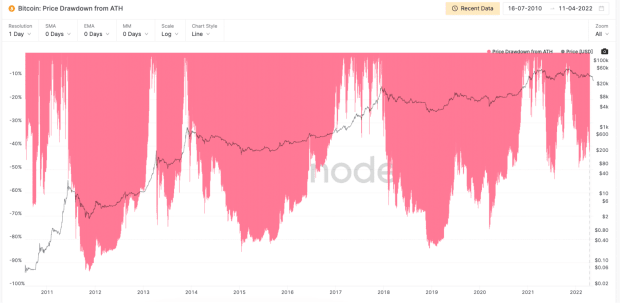
Recent years have seen shorter, smaller rallies and shorter, smaller drawdowns. This chart suggests that 50% drawdowns are the new normal, instead of 85%.
Now, we get into some technical analysis. I concentrate on the Relative Strength Index (RSI) because it is very basic and a fundamental building block of many other indicators. Monthly RSI is at levels that typically signal cycle bottoms. Currently, the monthly metric shows that bitcoin is more oversold than at the bottom of the corona crash in 2020. Weekly RSI is equally as oversold. It is as low as the bottom of the corona crash in 2020, and before that, the bottom of the bear market in 2018.
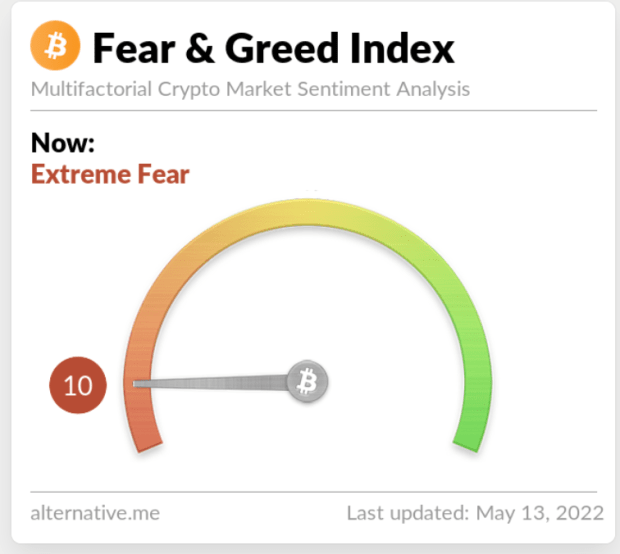
The Fear and Greed index is also extremely low. This measure is showing “Extreme Fear” that typically registers at relative bottoms and at 10, ties for the lowest rating since the COVID-19 crash in 2020.
In summary, my contrarian (bullish) argument is:
That does it for this week. Thanks to the readers and listeners. If you enjoy this content please subscribe, review and share!
This is a guest post by Ansel Lindner. Opinions expressed are entirely their own and do not necessarily reflect those of BTC Inc. or Bitcoin Magazine.
Bitcoin Price Analysis